Observability
Splunk Infrastructure Monitoring
Whether on-prem, hybrid or multicloud, Splunk delivers real-time monitoring and troubleshooting to help you maximize infrastructure performance with complete visibility.

Instant visualization
Get fast time to value with over 250+ cloud service integrations and pre-built dashboards out of the box for rapid, full-stack visualization. Autodiscover, break down, group, and explore clouds, services and systems in minutes.


Real-time actionable alerts
Act before infrastructure performance affects end-user experience. Instantly detect and accurately alerts on dynamic thresholds, multiple conditions and complex rules to eliminate alert storms and dramatically reduce MTTD/MTTR.
Centralized, enterprise controls
Answer business-critical questions in context and monitor service-level objectives and indicators instantly. Track custom metrics for business KPIs to token based access and usage controls.


Scale with confidence
Troubleshoot across thousands of microservices and billions of events without missing anything. Aggregate metrics before they're ingested or drop any unused metric time series so that you can focus on scaling your apps — not your monitoring bill.
Features
Speed, scale and analytics for hybrid infrastructure monitoring
Splunk Infrastructure Monitoring is a purpose-built metrics platform to address real-time cloud monitoring requirements at scale.

Full-stack visibility
Seamless correlation between your hybrid infrastructure and microservices paints a clearer picture with in-context insights for directed troubleshooting with no context switching.

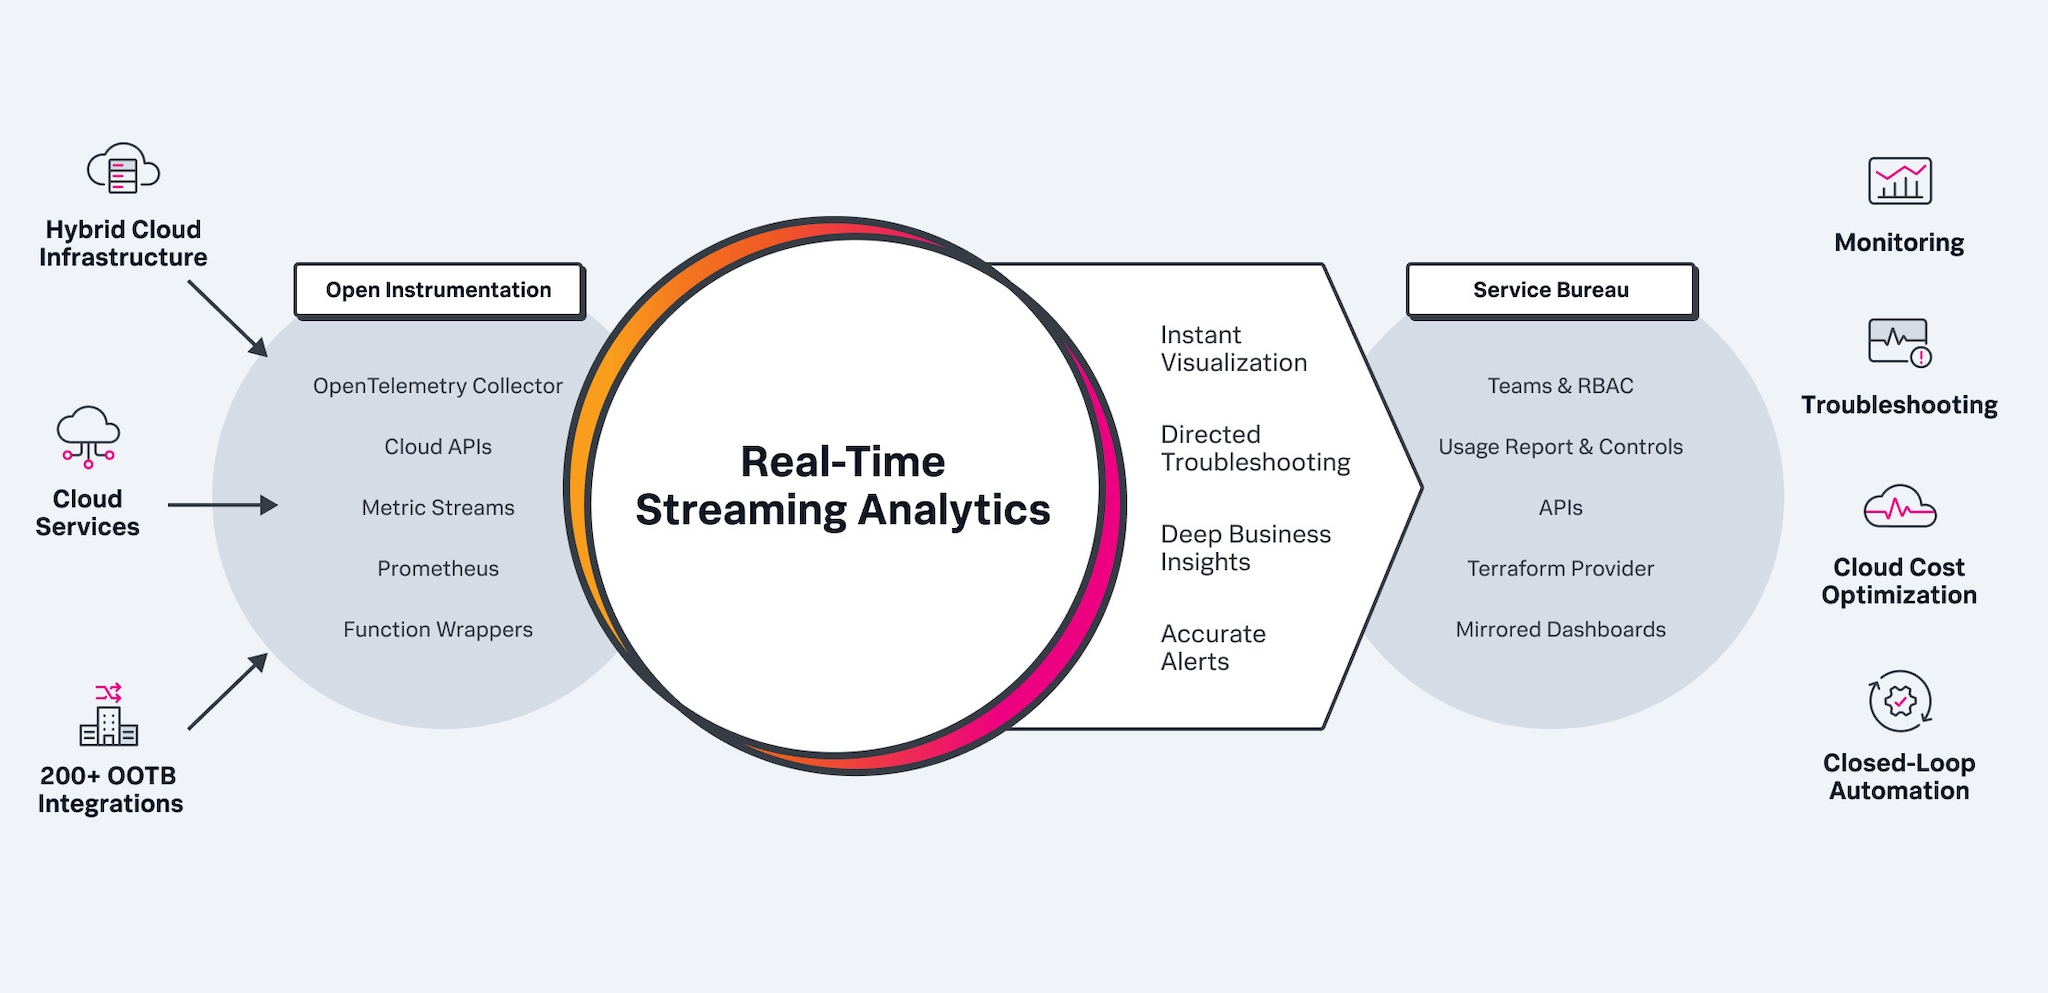
Real-time streaming analytics
When every second counts, only streaming architecture can ingest, analyze and alert in seconds. Blend metrics and logs for in-flight analytics from a single, integrated dashboard.

Centralized management
Shift-left monitoring with programmable APIs and monitor-as-code in CI/CD with transparency and enterprise controls for self-service deployment.

In-context troubleshooting with logs
Combine real-time metrics with logs already ingested in Splunk Platform via Log Observer Connect for deeper insights of your cloud and faster root cause analysis — in one centralized tool.

Instant Kubernetes-based network visibility
Remove the guesswork during cloud network issues and easily identify the source and impact of your network outages, reducing your MTTD and production downtime.

Advanced Kubernetes monitoring
Automatically discover and instantly visualize Kubernetes objects, their health and their performance with customizable dashboards and charts.

CUSTOMER STORY
Lenovo Offers Frictionless E-Commerce Experience With Splunk Observability
Splunk is a great investment for us, as it remarkably improves our operational efficiency and achieves better team collaboration. Thanks to this great tool, our operations team troubleshoots issues much faster than ever before.
~5 min MTTR
compared to previous 30 mins
100% uptime
despite online traffic increase of 300%
Helps to ingest a massive amount of raw data and use it effectively
Splunk helped us to effectively use all the data that we collect in a valuable way for different customers and groups that we have in our company.
Rodney Riettie,
Software Engineer
Industry:
Healthcare
Company size:
10K+
A Valuable Tool for Anyone Looking To Improve Their Infrastructure Monitoring
Monitor a wide range of data sources including log files, performance metrics, and network traffic data. Allows me to get a comprehensive view of my infrastructure and helps me to identify potential issues or security risks more quickly.
Industry:
Software
Company Size:
500M - 1B USD
Splunk Infrastructure Monitoring Review
Splunk is great for ingesting, storing and searching logs. They do a great job of constantly innovating and releasing new features. Our customer service representatives are communicative and helpful.
Brennan Fuller,
Systems Engineer
Church of Jesus Christ of Latter-Day Saints


Application Performance Monitoring
Solve problems faster in monoliths and microservices by immediately detecting problems from new changes, confidently troubleshooting the source of an issue and optimizing service performance.

Logs in Observability
Log analysis across your cloud-native application and cloud environments.

Real User Monitoring
The only full-fidelity, end-to-end visibility solution for end-user experience.

Synthetic Monitoring
Go beyond basic uptime and performance monitoring for better digital experiences.

Automated On-Call
Empower teams by routing alerts to the right people for fast collaboration and issue resolution.

Business and IT Service Monitoring
Protect service-level agreements and monitor service health with intelligent event management and ITSM integrations.
