Solve problems in seconds with the only full-stack, analytics-powered and OpenTelemetry-native observability solution.
solution
Unified observability across any environment
Eliminate blind spots
Get a clear picture of any stack — from monoliths running on-prem to microservices in the cloud — with near-instant visibility to performance and reliability.
Maneuver at the speed of innovation
Proactively observe hybrid infrastructure and swiftly triage and resolve issues for minimal impact on service reliability.
Realize peak efficiency
Build on the value of your data and reduce toil with simplified setup and seamless integration between all your data sources.

Real-time, NoSample™ data ingestion to immediately surface anomalies
Splunk’s purpose-built streaming architecture ingests data from any source at cloud scale and processes metrics with a resolution as fine as one second, to eliminate blindspots. SignalFlow provides the flexibility to take any combination of custom or standard metrics and alert based on any logic to identify all anomalies.
Empowering our technologists with strategic tools like Splunk Cloud Platform and Splunk Infrastructure Monitoring means they're not looking for a needle in a haystack.
No-code log integration in a single UI to optimize data usage
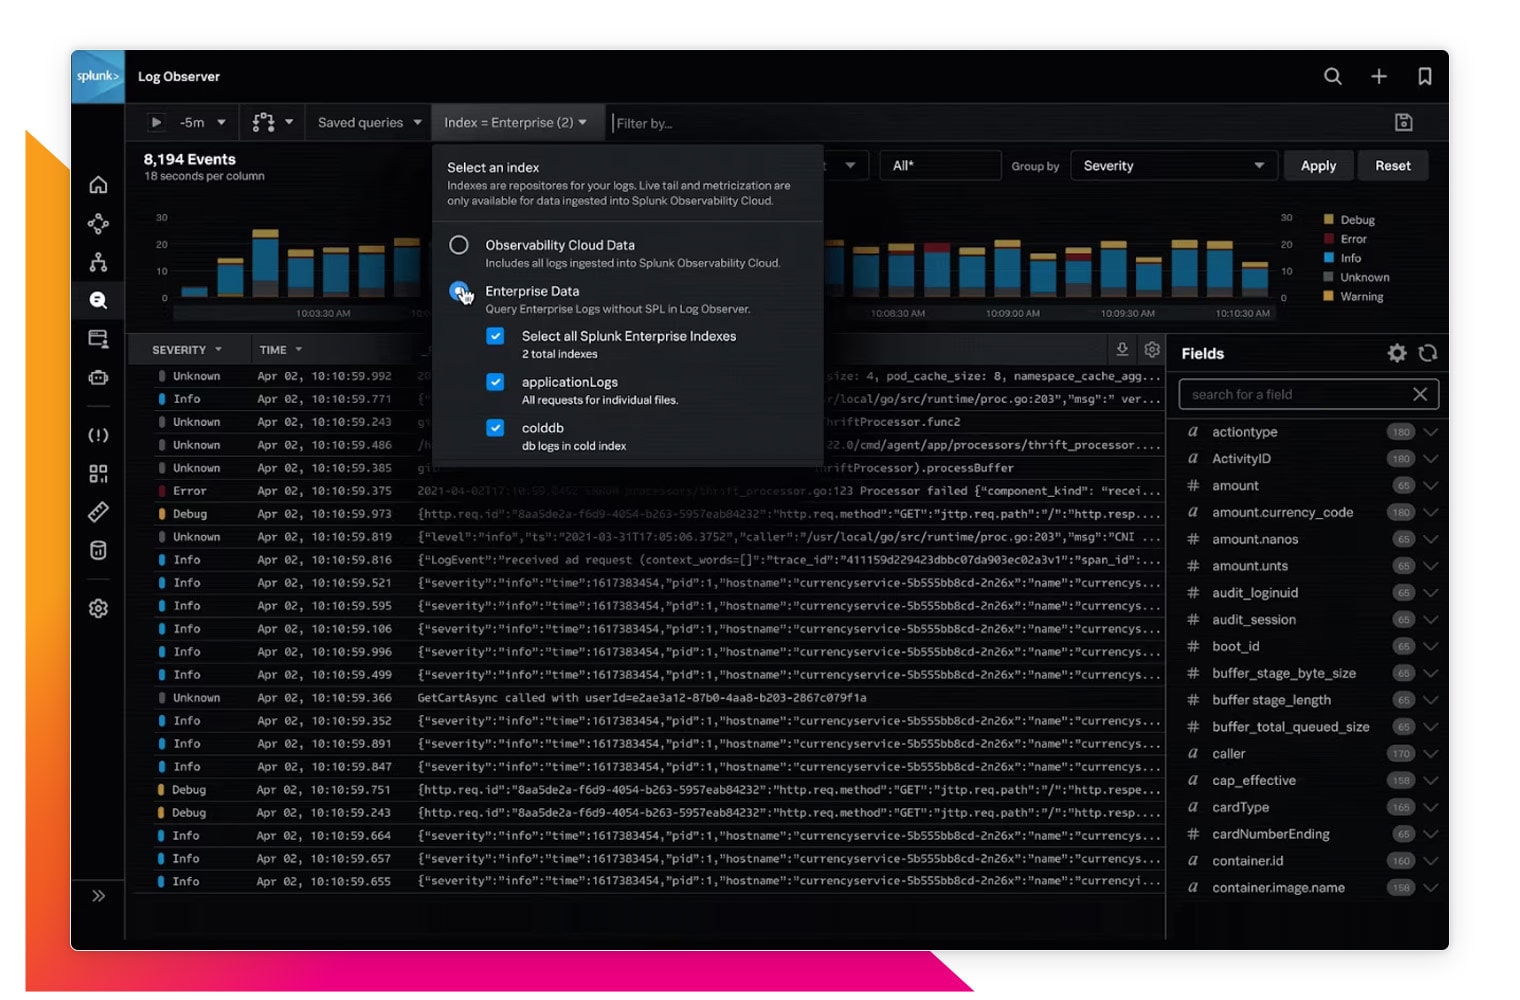
Ingest your logs once and use them anywhere for faster in-context troubleshooting and deep root cause analysis. Splunk Log Observer Connect, built into Observability Cloud, seamlessly brings logs from the Splunk Platform into dashboards and troubleshooting workflows, using a simple, no-code UI.


OOTB integrations and directed troubleshooting to speed issue resolution
Splunk provides visibility for on-prem applications and expands visibility to the cloud in minutes with hundreds of OOTB service integrations, prebuilt dashboards, and AutoDetect detectors/alerts. Built-in AI/ML capabilities quickly pinpoint the root cause of any issue.

