false
shared header v2
Push Down Banner V1 Analytics Patch, remove after implementing V2 (S9 or S10)
Global nav V2 patch, remove after adding the mobile languages fix in the codebase (S7 or S8)
See why Splunk is named a Leader
2023 Gartner® Magic Quadrant™ for Application Performance Monitoring and Observability
See why Splunk is named a Leader
2023 Gartner® Magic Quadrant™ for Application Performance Monitoring and Observability

Observability

Splunk® Application Performance Monitoring

Easily troubleshoot and optimize your applications — from monoliths to microservices

HOW IT WORKS

End-to-end visibility to solve problems faster

no-trace-left-behind-dashboard

Immediately detect issues from any change

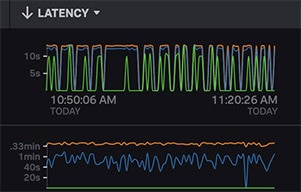
Real time alerting and detection, no blindspots. Immediately detect slowness, errors or anomalies from new deployments, updates or configurations. Quickly visualize your entire distributed system to scope the severity of a problem, find which services, tags, and key components are impacted, and understand the likely source of the issue itself.
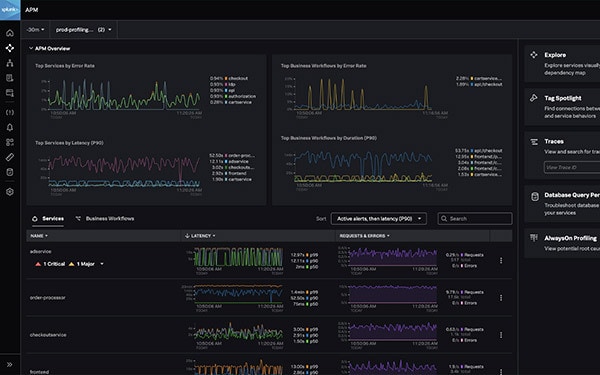
Confidently troubleshoot the source of an issue

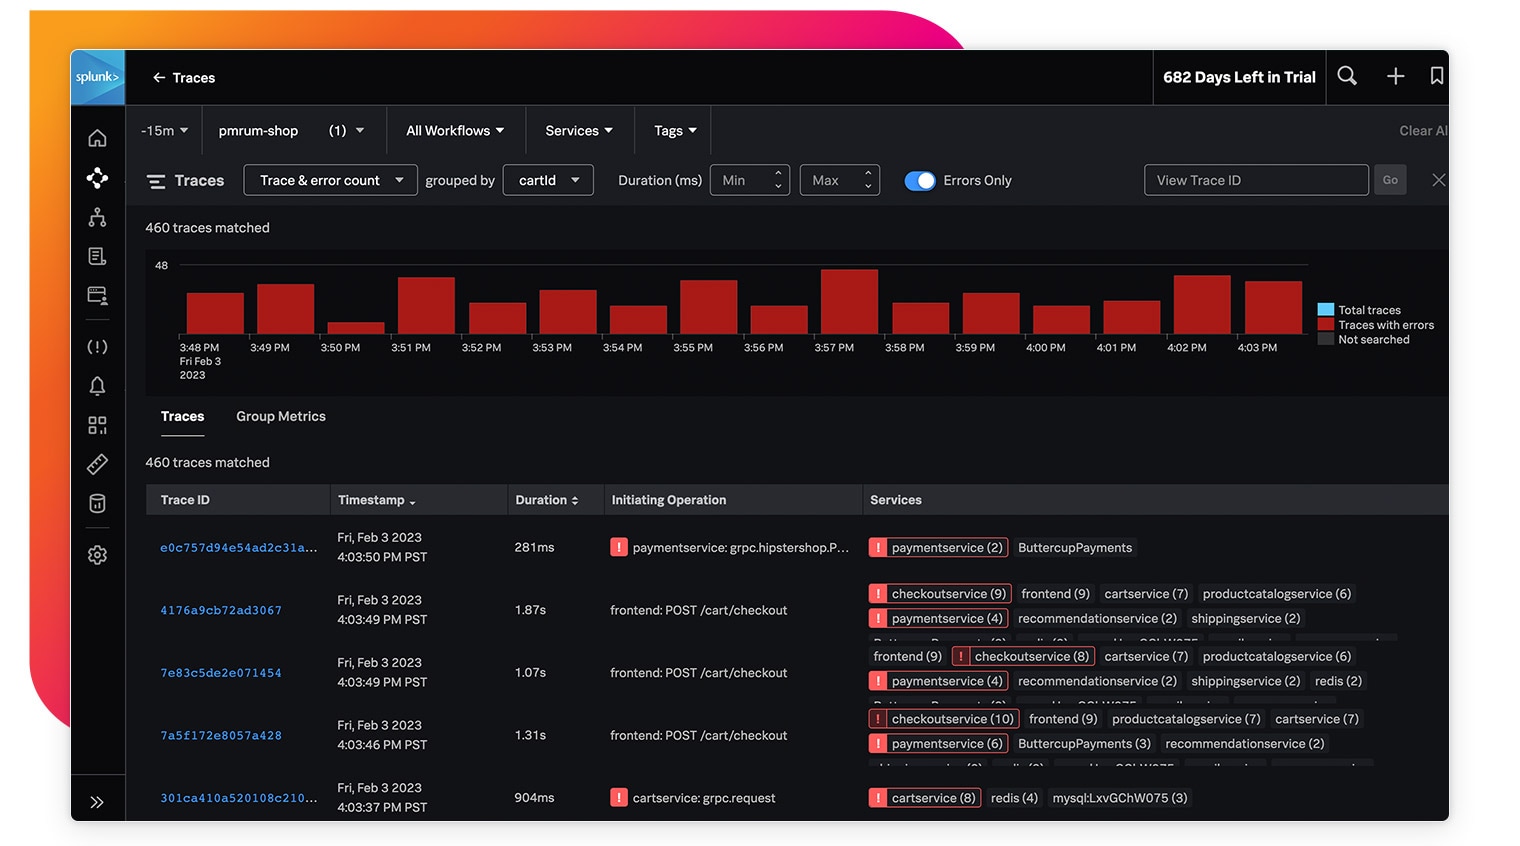
Isolate the source of an issue with ease. Receive AI-directed troubleshooting to guide you to the likely source of slowness or errors impacting services and customers the most. Solve problems faster across every transaction by seamless navigating from traces to your logs, and the line of code responsible, connected in one fluid experience.

troubleshoot-issues-in-seconds
opentelemetry

Optimize service performance

Optimize service performance by understanding how services, APIs and third party dependencies impact your end user experience and business workflows. Easily view dependencies across your monolithic apps and microservice to prioritize what to fix first.

Continuous code profiling

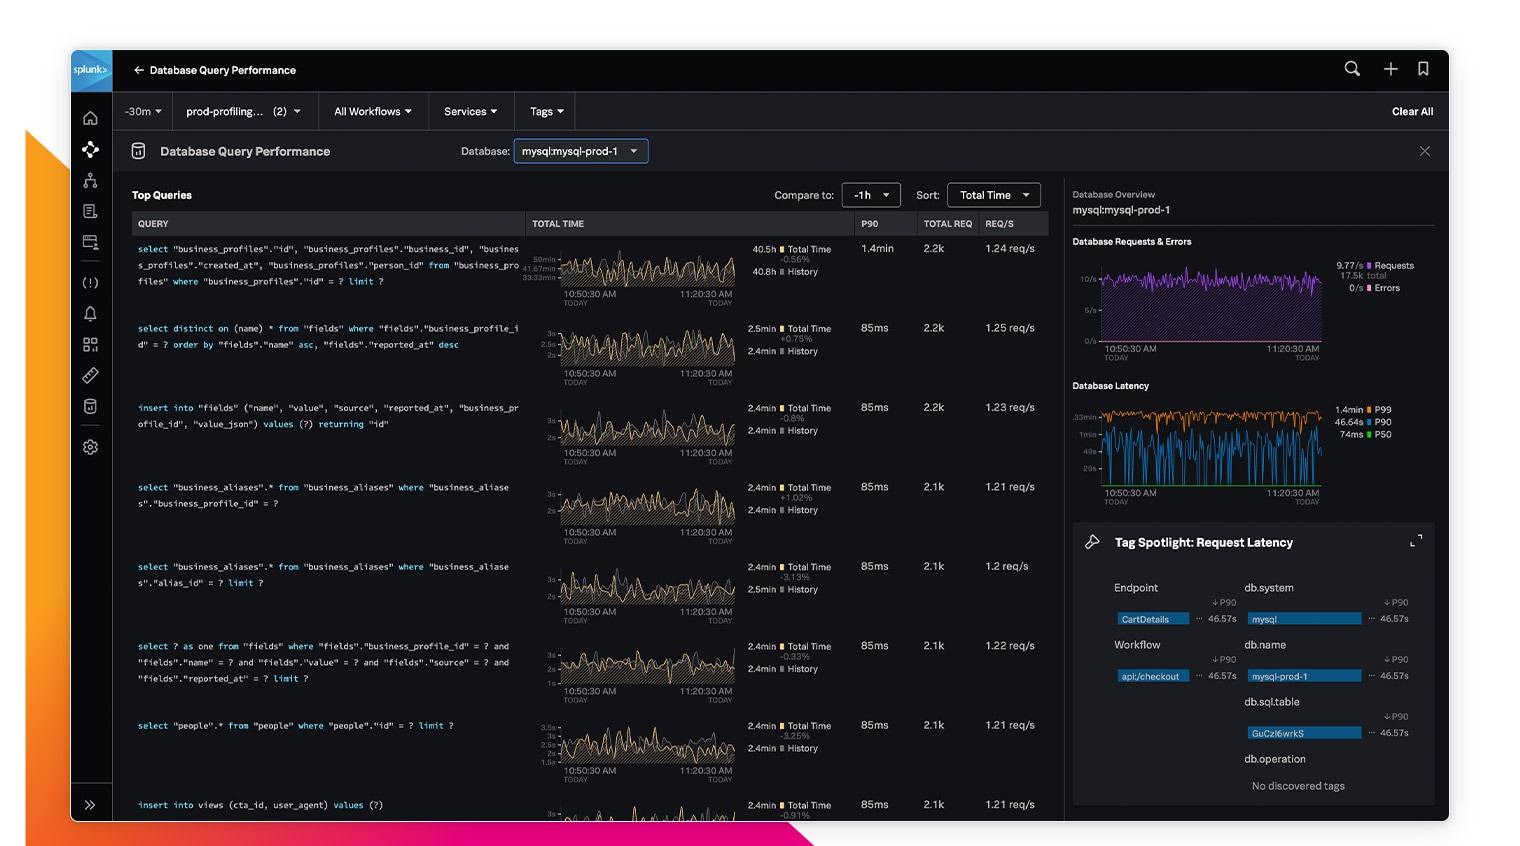
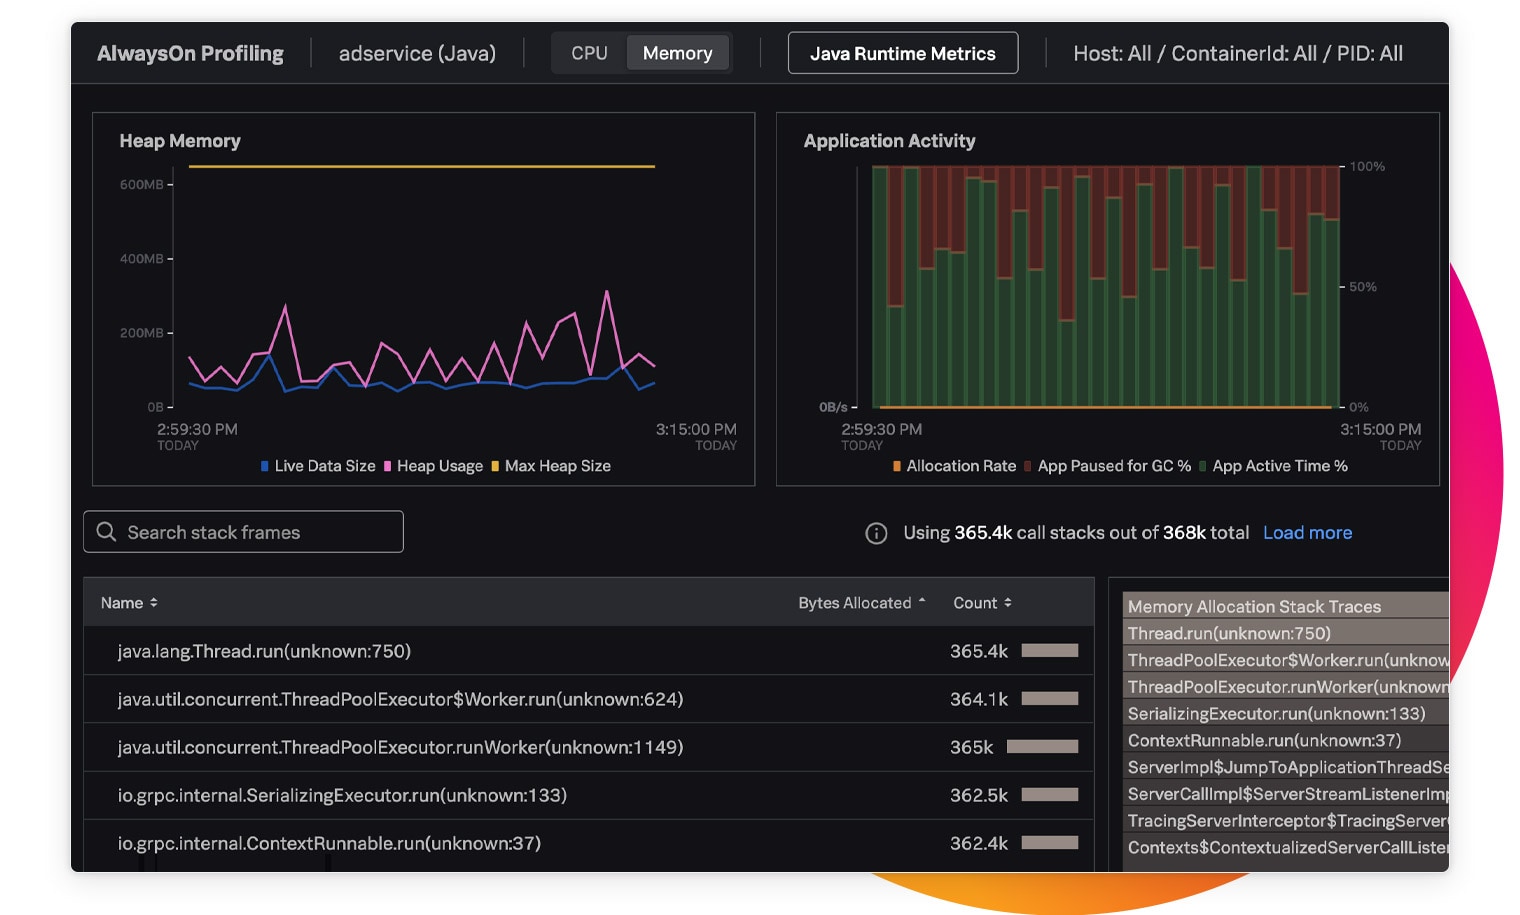
AlwaysOn continuously analyzes code-level performance in context with trace data, with minimal overhead. Find and fix service bottlenecks, and identify resource optimization opportunities anywhere in your environment.

full-stack observability

Features

End-to-end visibility and no blind spots

Full visibility into all the data from every system dependency and at any scale helps you troubleshoot complex environments significantly faster.

no sample no sample

Complete distributed tracing

Identify problems in microservices more effectively by viewing every trace, seamlessly connected from backend services through web and mobile apps

service mapping service mapping

Service mapping

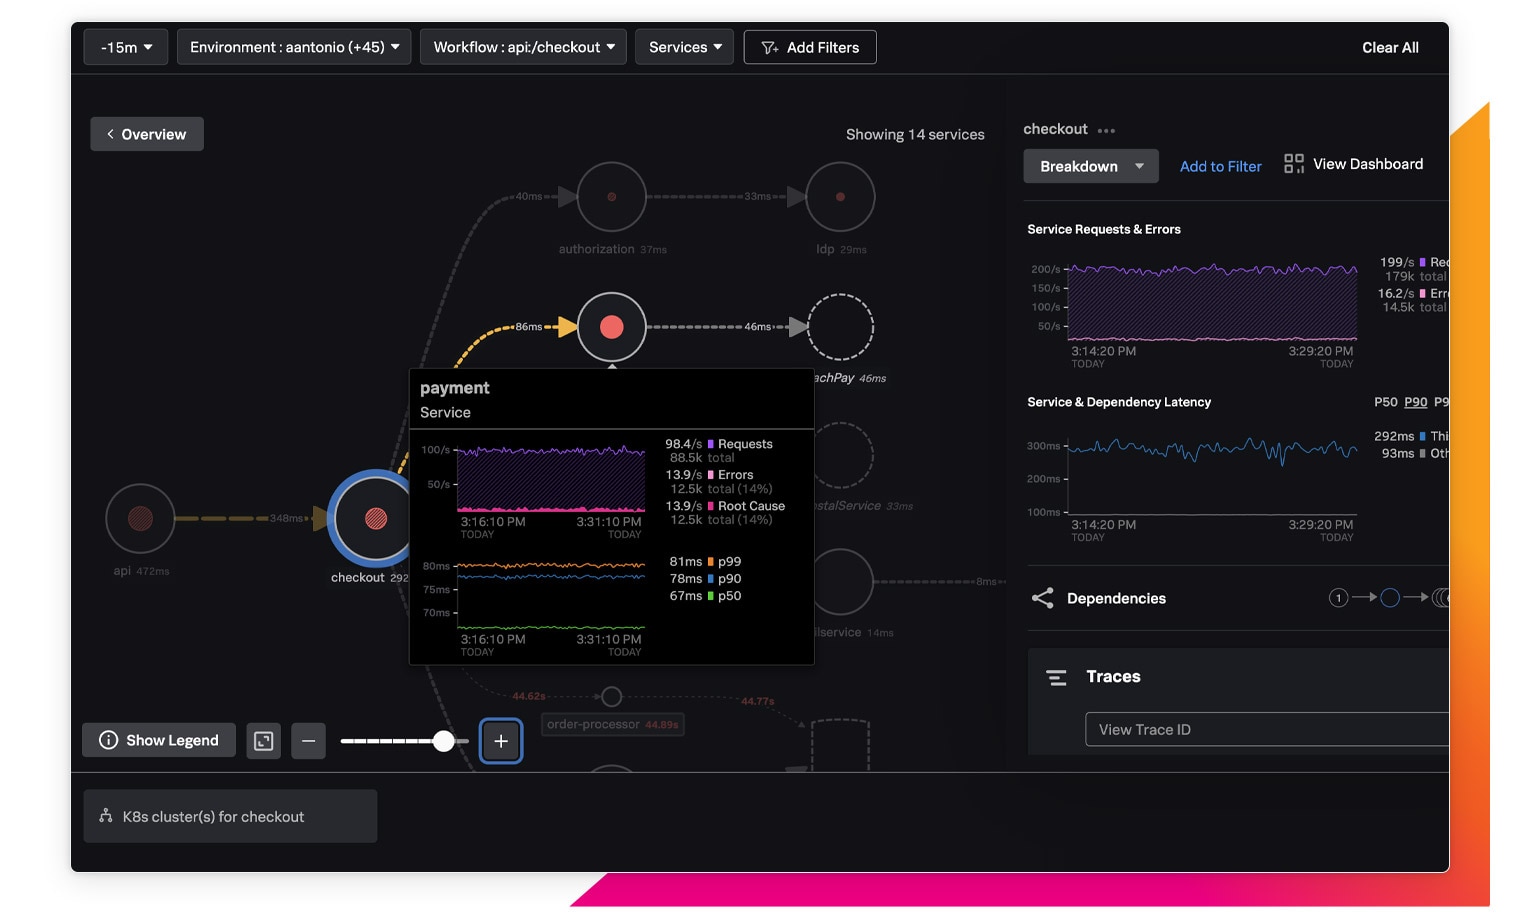
Splunk APM’s dynamically generated service maps provide DevOps teams with out-of-the-box visibility into all service interactions, inferred services, dependencies and performance.

tag spotlight tag spotlight

Tag spotlight

Quickly correlates events in latency or errors with tag values, providing a central location to understand how traces behave across your entire system.

business workflows business workflows

Business workflows

Group together end-to-end traces based on any common service or tag to track important business transactions with Splunk APM. Developers can further visualize how their microservices impact all the workflows that use them.

smart dynamic alerting smart dynamic alerting

Smart dynamic alerting

Dynamic alerting enables your DevOps teams to set alerts based on static thresholds, sudden changes or historical anomalies for easier alerting and fewer alert storms.

complete user-activity capture complete user-activity capture

Code-level visibility

Splunk APM’s “Always On” code profiling analyzes code-level performance in context with trace data, helping troubleshoot bottlenecks and optimize performance in cloud-native and monolithic applications.

care.com care.com

CUSTOMER STORY

Care.com Refactors Monoliths Into Microservices With Splunk Observability

Splunk captures all the logs, metrics and traces in a way that allows us to understand any event across our platform, so we can ask questions and get answers.

Matt Coddington, Senior Director of DevOps Engineering, Care.com
Gartner® and Peer Insights™ are trademarks of Gartner, Inc. and/or its affiliates. All rights reserved. Gartner Peer Insights content consists of the opinions of individual end users based on their own experiences, and should not be construed as statements of fact, nor do they represent the views of Gartner or its affiliates. Gartner does not endorse any vendor, product or service depicted in this content nor makes any warranties, expressed or implied, with respect to this content, about its accuracy or completeness, including any warranties of merchantability or fitness or a particular purpose.

INTEGRATIONS

Deploy on any stack at any scale

integrations

Related products

rum rum

Real User Monitoring

The only full-fidelity, end-to-end visibility solution for end-user experience.

Splunk RUM
Logs in Observability Logs in Observability

Logs in Observability

Log analysis across your cloud-native application and cloud environments.

Log Observer Connect
Infrastructure Monitoring Infrastructure Monitoring

Infrastructure Monitoring

The only real-time, analytics-driven multicloud monitoring solution for all environments.

Splunk Infrastructure Monitoring
Synthetic Monitoring Synthetic Monitoring

Synthetic Monitoring

Go beyond basic uptime and performance monitoring for better digital experiences.

Splunk Synthetic Monitoring
Automated On-Call Automated On-Call

Automated On-Call

Empower teams by routing alerts to the right people for fast collaboration and issue resolution.

Splunk On-Call

Get started

Try Application Performance Monitoring as part of the 14-day Splunk Observability Cloud free trial. Whether you need full-fidelity monitoring and troubleshooting for infrastructure, application or users, you can get it all in real time and at any scale. No credit card required.