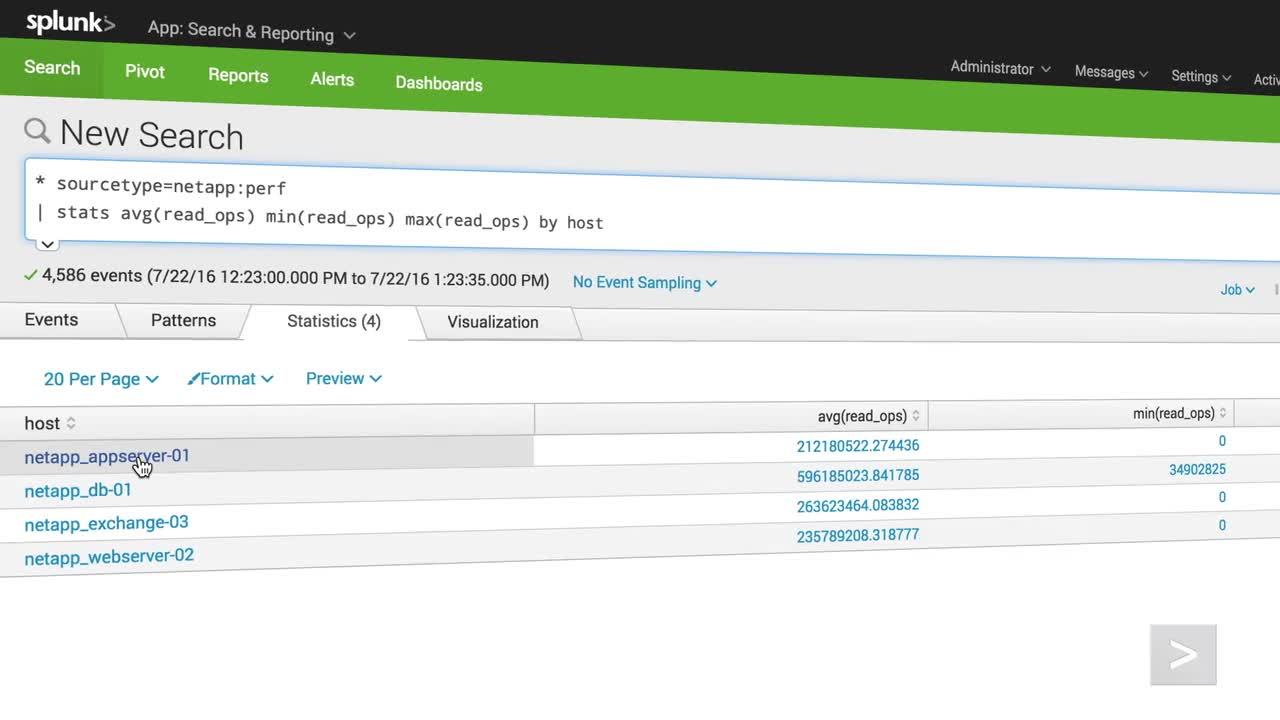

Chart, Predict and Visualize Statistics
Use the powerful “stats” command with over 20 different options to calculate statistics and generate trends. Then chart and visualize those results and statistics over any time range and granularity.
Related Videos

End-to-End Observability Drives Great Digital Experiences
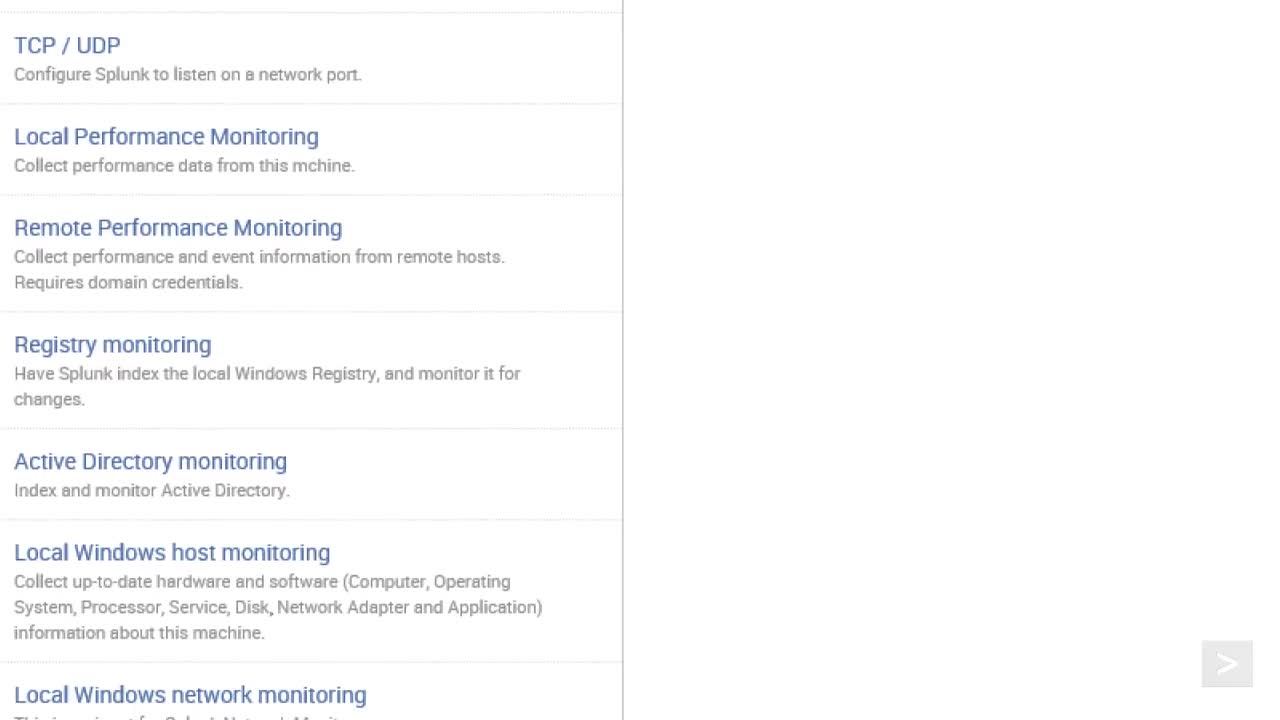
Getting Data Into Windows

