 By Stephen Watts July 28, 2023
Adaptive thresholding is a term used in computer science and — more specifically — across IT Service Intelligence (ITSI), for analyzing historical data to determine key performance indicators (KPIs) in your IT environment. Among other things, it’s used to govern KPI outliers in an effort to foster more meaningful and trusted performance monitoring alerts.
The thresholding method specifies the acceptable high and low values for the data produced by IT infrastructure, and is a crucial element of performance monitoring. ITSI offers two threshold types: static and adaptive. Static thresholds allow IT teams to use policies to select different static values for KPIs at different times of the day and week. Adaptive thresholding, on the other hand, uses machine learning to dynamically calculate time-dependent thresholds for these KPIs, allowing operations to more closely match alerts to the expected workload on an hour-by-hour basis.
Adaptive thresholding enables service status to be viewed along a gradient of normal to abnormal — rather than a binarization state of either working or broken. A service that reaches a critical threshold may warrant an alert, for example, but a high threshold — though concerning — probably would not. This more discerning approach reduces alert fatigue and helps IT teams direct their energies toward the most critical issues.
In the following sections, we’ll look at how adaptive thresholding works, how it’s used and various adaptive threshold methods, as well as why it should be an important part of your organization’s performance monitoring strategy.

What is ITSI?
Information Technology Service Intelligence (ITSI) refers to a software solution that uses machine learning to help IT managers monitor complex IT environments and manage analytics-driven IT operations.
ITSI tools are used to monitor and analyze network events to predict and prevent service disruptions. To do that, they rely on AI algorithms to identify patterns and trends in network activity that could result in service degradation or downtime if they’re not proactively corrected. By using an alert-based system, ITSI tools enable IT teams to take corrective action to prevent disruptions and outages.
ITSI tools generally employ a four-step process:
- Collection: The tool gathers data in the form of network events, log files, metrics, and other sources from across the network, which is then aggregated to provide IT administrators a high-level view of network performance.
- Analysis: The ITSI tool processes the data using advanced machine learning and algorithms to identify and track patterns for each data source.
- Prediction: As the algorithms process more and more network data, they learn what constitutes normal behavior, thus enabling them to predict performance for a given metric and pinpoint the likely causes of service issues before they occur.
- Action: IT teams can use the insights generated by ITSI to act on service issues before they impact users and make sure that agreed-upon service levels are met.
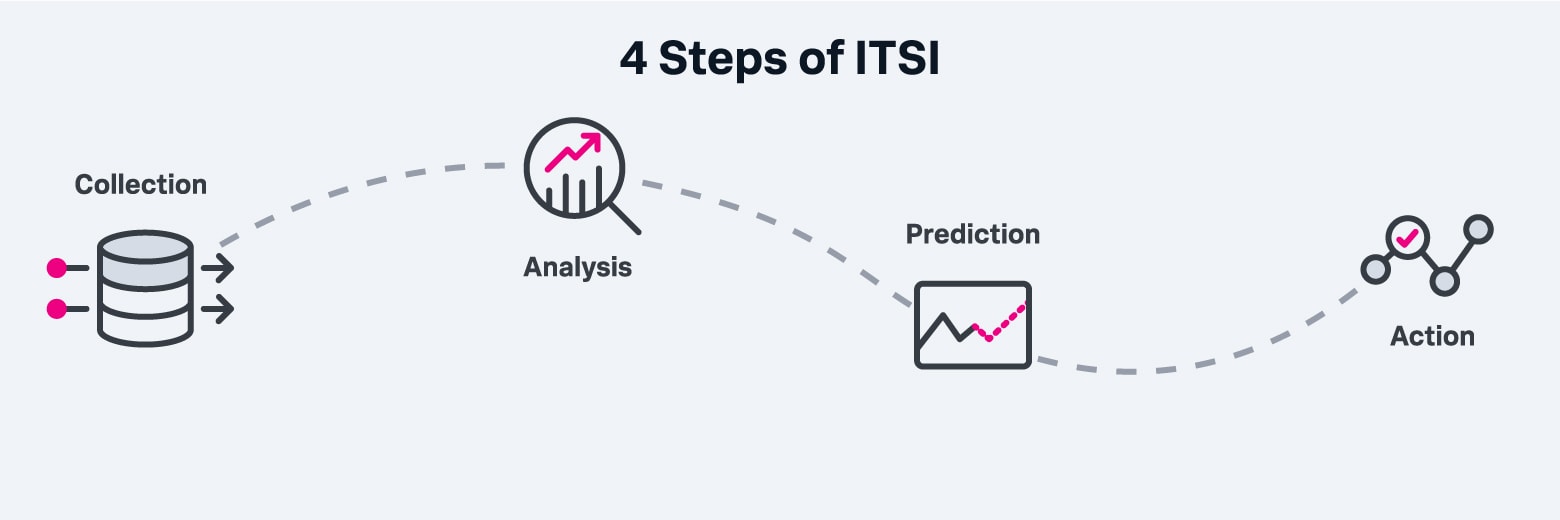
ITSI tools employ a four-step process that includes collection, analysis, prediction and action.
What are KPIs?
KPIs, or key performance indicators, are benchmarks by which the performance of a network and its components are measured. KPIs differ from metrics in that KPIs define an outcome, whereas metrics are data points that are used together to measure progress toward that outcome. For example, “reliability” is a common KPI that expresses the probability that a service will perform its required functions over a specific period of time. It’s calculated using two essential failure metrics: Mean Time to Repair (MTTR) and Mean Time Between Failures (MTBF).
While there’s no universal standard for what enterprise KPIs should monitor, the following are commonly used to assess the overall status of a service:
- Availability: This KPI represents the percentage of time that a service or system is available and is critical because it indicates how successfully you delivered services to your customers. For example, if the agreed optimal service time was 100 hours, and you experience two hours of downtime, then availability would be 98%.
- Reliability: Reliability is calculated using the metrics MTTR, which measures the average time required to repair and restore a failed system, and MTBF, which measures the average time a device or system is expected to function before it fails. Reliability is important because hardware degradations over time can cause service performance to deteriorate for end users.
- Throughput: Throughput, or bandwidth, describes the flow rate of a service or device over a defined period, often measured as transactions per second, megabytes per second, or the number of supported users, depending on the service. Throughput is an important indicator of how efficiently applications and services are running.
- Latency: This KPI tracks how long it takes for data to arrive at its destination — for example, the time between a user request and an application’s response. Latency is important because high latency compromises the user experience and related issues can be exacerbated in cloud environments.
- Response time: This KPI describes the elapsed time between a request sent to a system and the time it takes for the system to complete that request. Response time is one of the clearest indicators of cloud performance, incorporating a variety of security metrics such as Mean Time to Detect (MTTD), Mean Time to Contain (MTTC), Mean Time to Resolve (MTTR) and Mean Time to Recovery (MTTR), among others. It also impacts availability and application performance.
- Scalability: Scalability indicates how well a service can support a defined level of growth. This KPI is important in understanding if a particular service can handle a high number of user requests without crashing, for example.
In ITSI, a KPI is saved as a search that returns the value of an IT performance metric, such as CPU load percentage, memory usage or response time. Each KPI is associated with a specific service, which allows you to use KPI search result values to monitor service health, check the status of IT components, and troubleshoot trends that might indicate an issue with your IT systems.
KPIs can be used together to determine the overall health and performance of your IT environment, and ultimately help measure progress toward various objectives and goals. Specifically, KPIs can help with:
- Identifying and resolving issues: Cloud service vendors provide their clients with little visibility into the hardware underlying their infrastructures, so organizations must interpret enormous volumes of infrastructure data to help identify the cause of performance issues. However, not all data is significant, making it difficult to uncover the root cause of problems. KPIs are essential for filtering the noise from cloud infrastructure data so IT teams can extract useful insights and act on them to identify and resolve potential issues.
- Reporting: KPIs allow organizations to translate data into visualizations, summaries, and other digestible reports to better understand performance trends and outcomes. This enables business leaders to make well-informed decisions about infrastructure investments.
- Optimization: In addition to maintenance, IT teams are also expected to continually improve the performance of their IT environment. KPIs play a significant role in assessing inefficiencies and determining the best path to improving IT infrastructure to deliver the highest possible service performance to customers.
- Service-Level Agreements (SLAs): KPIs can help IT teams ensure that the performance standards in their vendors’ service level agreements (SLAs) are being met.
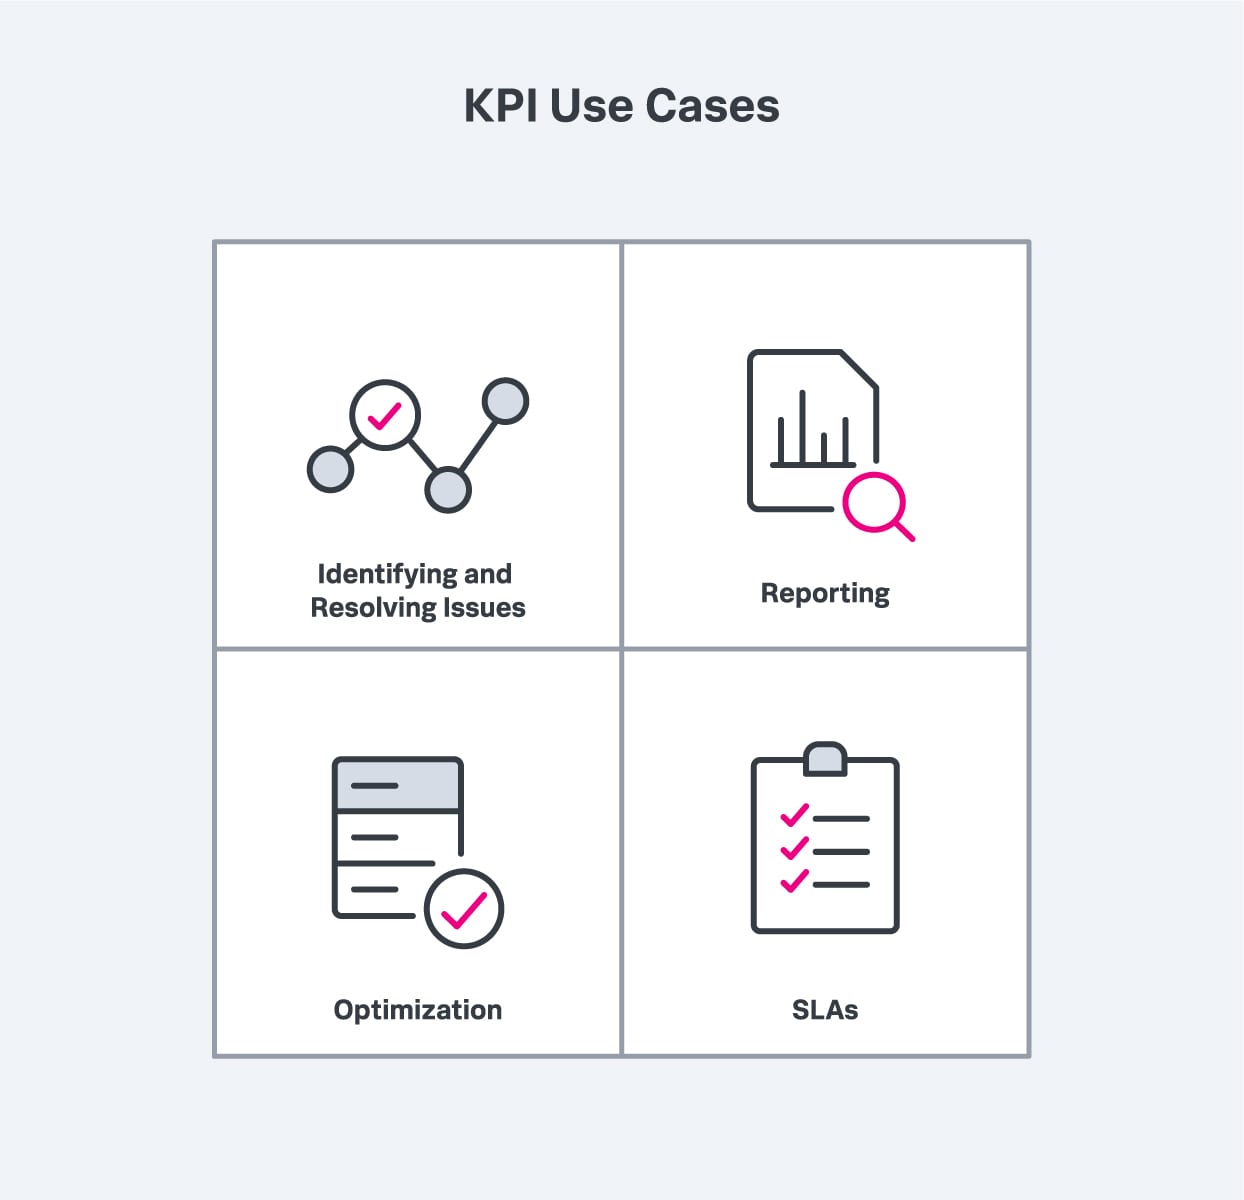
KPIs can be used to identify and resolve issues, report on performance trends, improve performance and ensure that SLA performance standards are being met.
How does adaptive thresholding work?
Adaptive thresholding works by using machine learning techniques to analyze historical data, sometimes displayed in a histogram, for patterns that help define the normal state of your environment. You configure different threshold values, or intensity values, to determine the current status of any particular KPI to then drive more meaningful alerts. The simplest form of global thresholding is binary thresholding, or thresh_binary, which applies to an either/or outcome. But most thresholding is applied on a grayscale.
To better understand how this process works, you need to familiarize yourself with a few ITSI concepts — like service health scores, KPIs, and dependent services (sometimes called subservices):
- KPI: a benchmark of the performance of a particular service.
- Service health score: a weighted average of the severity values of a service's KPIs and its subservices.
- Subservice: any service on which the configured service depends.
These concepts are designed as a hierarchy. Each service in your environment receives a health score that is calculated based on the status of the KPIs and subservices you define for that service, known as an adaptive_thresh_mean_c. Every KPI requires a threshold configuration. ITSI, which continuously monitors KPI statuses and health scores, allows for six different severities — normal, critical, high, medium, low and info/informational. When KPI severity for a service reaches a defined level in tandem with changes in that service’s health score, it indicates a potential problem and triggers an alert.
When configuring thresholds and alerts, it’s best to maintain simple thresholding. Below are a few best practices:
- Determine which severities you’ll use: While ITSI allows six severity levels, you don’t have to — nor should you — use all of them. Consider using just “normal” and “critical” severities until you feel you have a handle on adaptive thresholding techniques.
- Keep severity definitions consistent: You need to decide what each severity means for your organization and ensure that every KPI is thresholded to the same definitions. (“Critical,” for example, could mean a KPI status will immediately trigger an alert, whereas “high” could indicate a KPI is just outside normal boundaries.) Clearly defined severities help ensure consistent KPI thresholding across different teams and make alert generation and remediation processes more manageable as your ITSI efforts scale.
- Don’t threshold every KPI: You will have KPIs that you won’t want to threshold because they’re:
- Being monitored by other tools.
- They don’t indicate problems.
- They don’t produce consistently reliable results.
- You just don’t know how to threshold them.
In these cases, you can choose the “info” severity for all KPI results without impacting the service’s health score.
How is adaptive thresholding used?
Adaptive thresholding is used to configure severity level thresholds in ITSI, which determine the current status of any given KPI. When a KPI’s value meets or exceeds its threshold conditions, the KPI status changes — from “high” to “critical,” for example — indicating a possible issue with a service. KPI thresholds are used with other configurations such as service health scores to drive more relevant alerts that help IT teams proactively troubleshoot and resolve performance problems.
Why is adaptive thresholding important?
Adaptive thresholding is important because it helps solve the challenge of monitoring cloud IT environments. Cloud service providers abstract away the hardware underlying their infrastructures, which makes it difficult for clients’ IT teams to identify the root cause of performance problems. Modern performance monitoring tools thus rely on machine learning techniques to collect, correlate, and interpret terabytes of data to gain insights into application performance, availability of services, latency and throughput, and other indicators of cloud environment health.
A central tenet of monitoring cloud environments is to continuously evaluate the health of the applications and services running on them to ensure optimal workflow. Adaptive thresholding is a critical tool in this regard as it enables organizations to understand the current status of their KPIs and proactively respond to status changes that may indicate a problem. This in turn helps them to prevent downtime that could result in dissatisfied customers and lost revenue.
What are the most common algorithms for adaptive thresholding?
Because infrastructure data can vary widely, ITSI supports three types of adaptive thresholding algorithms: standard deviation, quantile and range-based.
- Standard Deviation: The standard deviation algorithm shows how much variation from the mean exists in the data set, thus making it a good choice if your data is well distributed around a mean. You can define thresholds based on multiple gray levels of the standard deviation from the mean, with negative values producing thresholds below the mean and positive values producing thresholds above the mean. However, if there are outliers in your historical data, they may cause much larger threshold values than you want. Also, if your data is skewed — larger values and outliers present, but smaller values and outliers not present — it might be difficult to generate meaningful lower bound thresholds. In these cases, the standard deviation algorithm may still be an option if you’re only concerned about meaningful thresholds in the direction of the skew.
- Quantile: With the quantile algorithm, you can place threshold bounds at various percentiles based on your historic data. For example, you could set critical severity for data points falling below the first percentile (0.01) and above the 99th percentile (0.99). The quantile algorithm requires that you select percentile threshold values between zero and one, meaning this algorithm will never produce thresholds above or below the historical minimum and maximum values of your data. This kind of segmentation may cause your threshold bounds to repeatedly cross if you presume future data will behave like historic data, which could then influence your alarming strategy. Quantile is more resistant to large outliers in historical data, making it a better option than standard deviation for wider variances.
- Range: The range algorithm is concerned with the minimum and maximum data points from your historical data and the span between those values (max-min). Your thresholds then become a multiplier of the span added to the minimum. For example, a value of 0 will set a threshold to the historic data minimum, a value of 1 will set a threshold to the historic data maximum, a value of -1 will set the threshold to the minimum minus the span, and a value of 2 will set the threshold to the maximum plus the span. Outliers in your historical data will impact the span value which in turn will affect the thresholds. Range is a good choice if you want to specify thresholds beyond historical data minimums and maximums and the standard deviation algorithm doesn’t work for you.
How does adaptive thresholding fall under ITSI?
Adaptive thresholding helps IT teams continuously monitor the status of their KPIs to enable more meaningful alerts. It’s an important component of ITSI, which stresses the use of machine learning-driven analytics to monitor and troubleshoot cloud IT environments.
Why is machine learning important in adaptive thresholding? What are some machine learning techniques in adaptive thresholding?
Machine learning is important in adaptive thresholding because of its ability to discover patterns, draw inferences and make predictions. Cloud IT environments produce terabytes of data every day, far more than humans can parse manually. Machine learning algorithms perform these tasks more efficiently and accurately making them an essential tool in all aspects of performance monitoring.
Adaptive thresholding commonly uses a couple of machine learning techniques to discover patterns in data and make predictions based on them: regression and classification.
Regression analysis examines a dependent variable (the action) and several independent variables (outcomes) and assesses the strength of the relationship among them. It’s commonly used to forecast trends, predict the impact of a particular action, or determine whether an action and outcomes are correlated. Regression analysis encompasses several commonly used algorithms including, simple linear regression, logistic regression and ridge regression.
Classification sorts data into categories for more accurate analysis. It uses different mathematical techniques, including decision trees and neural networks.
The Bottom Line: Adaptive thresholding enables more accurate alerts
Cloud environments bring a host of business benefits to the enterprise, but their complexity can result in high noise levels, alert fatigue, and an inability to identify and respond quickly to performance issues. Adaptive thresholding is an essential technique for improving your service monitoring and empowering your IT team to head off issues before they degrade performance.
What is Splunk?
This posting does not necessarily represent Splunk's position, strategies or opinion.